Usage Statistics
Product information
Release v0.1.0 (Updated )
Reviews
0 von 5 Sternen
0 purchases
History of CPU, memory, disk and network per server and node: graphs for admins and users, plus Prometheus metrics.
€9,99
Release historyDescription
Pterodactyl only shows what a server uses right now. Which server ate the node's memory last night, how full a node was over the last month, which servers cause the most traffic: once the console is closed, the numbers are gone. Usage Statistics records them and shows them as graphs.
Collected for you
- CPU, memory, disk, network traffic and state of every server, every minute or every five minutes
- One request per node: Wings lists all its servers with their usage in one answer, all nodes are asked at the same time
- Node totals for every moment, offline nodes are detected and skipped
- Every sample kept for 24 hours, 15-minute averages for 30 days, hourly averages for a year, peaks included; all periods adjustable
For admins
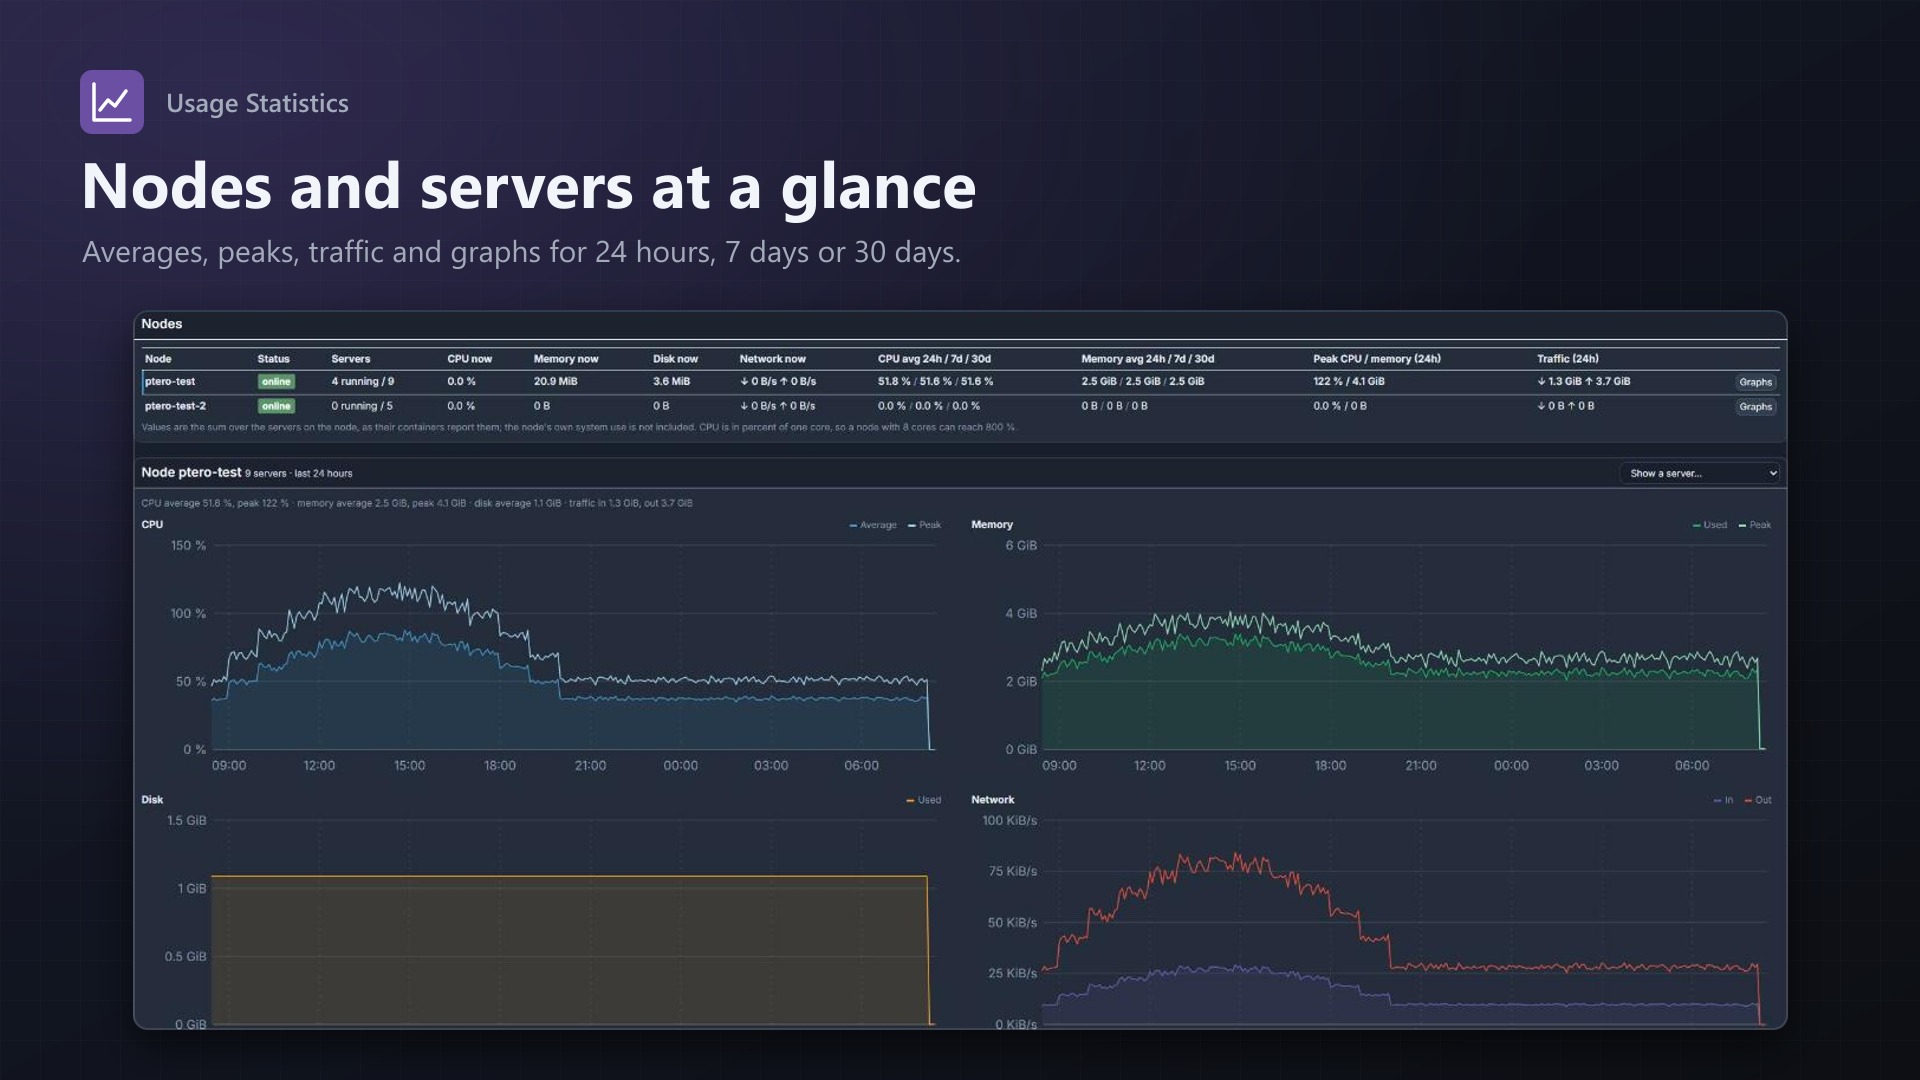
- Node overview: status, running servers, CPU, memory, disk and network now, averages over 24 hours, 7 days and 30 days, peaks and traffic
- Top servers by CPU, memory, disk and traffic
- Graphs for every node and every server: 24 hours, 7 days or 30 days
- Drawn on the server, no external scripts or CDNs
For your users
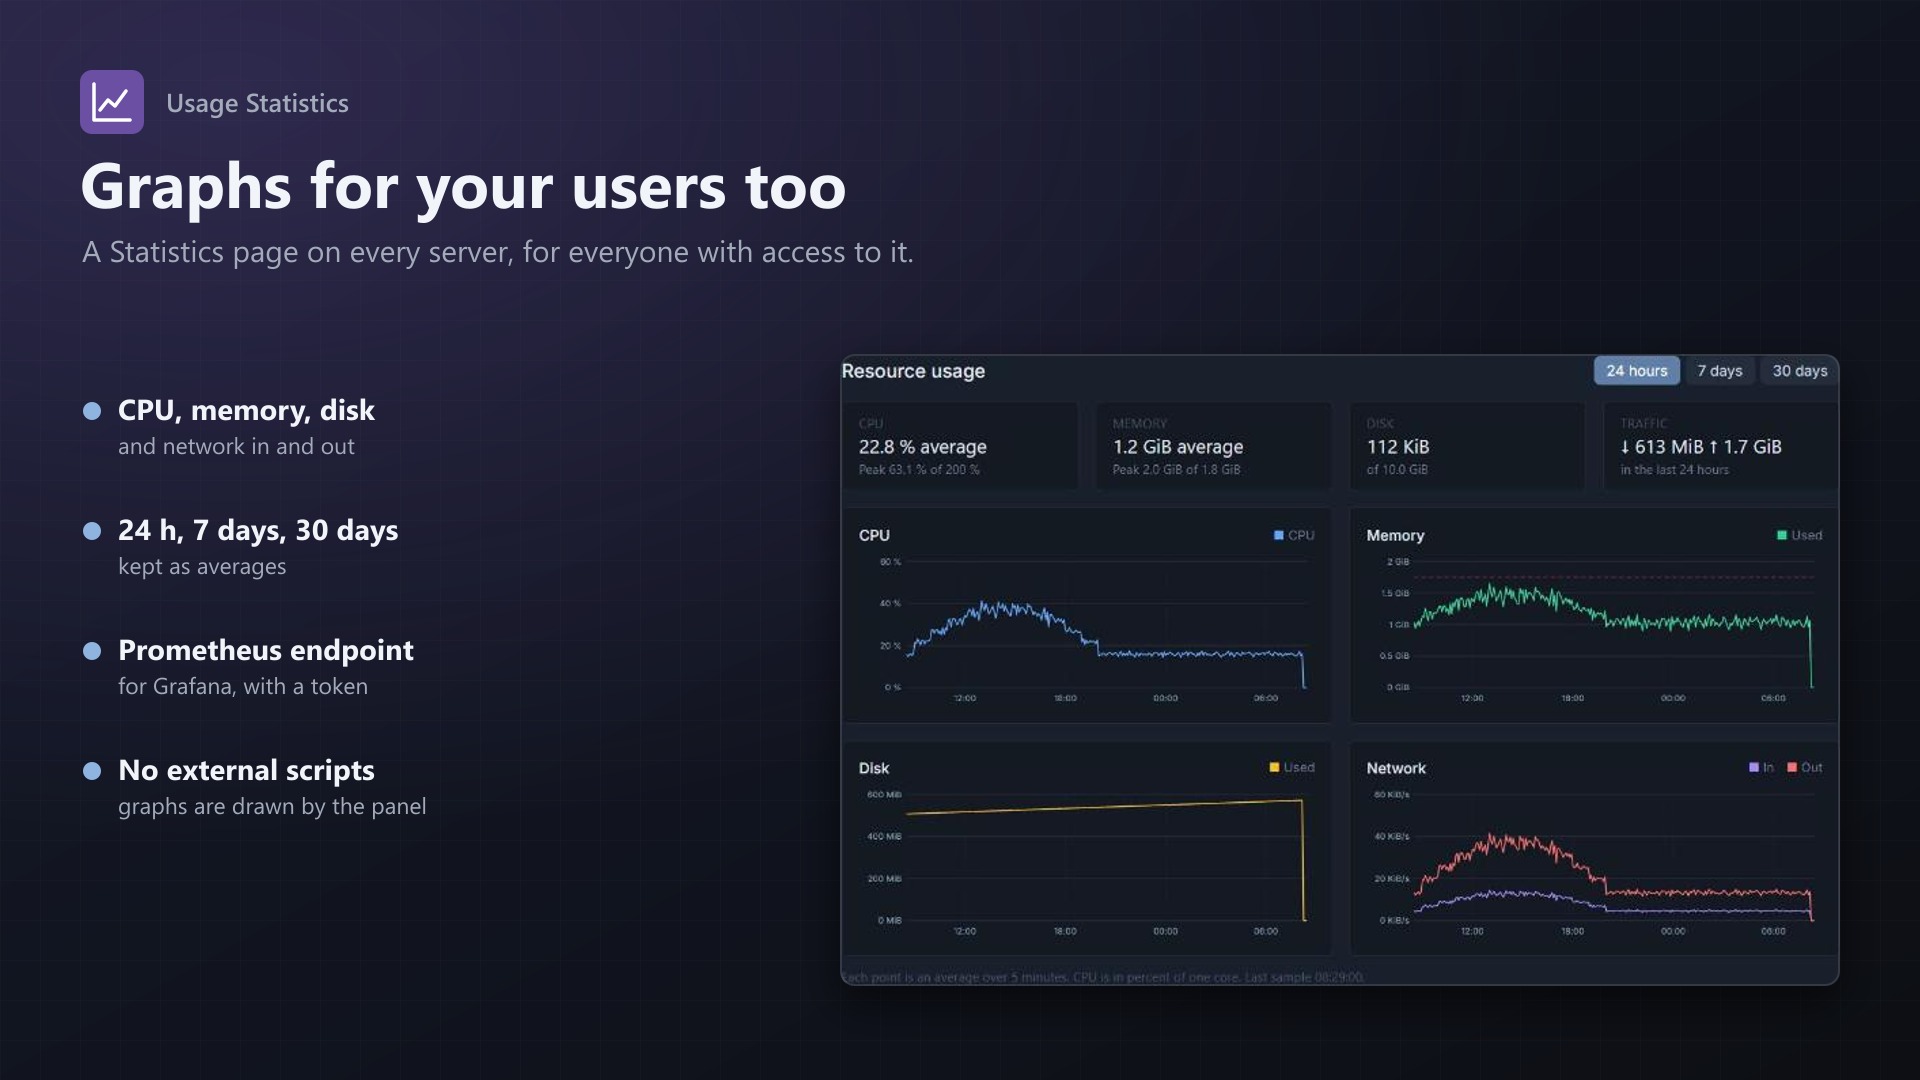
- A Statistics page on every server: CPU, memory, disk and network graphs with averages, peaks and limits
- Only for the owner, subusers and admins of the server
Prometheus and Grafana
- Metrics endpoint with a bearer token (stored hashed, shown once, new one at a click)
- Per server: CPU, memory, memory limit, disk, network counters, running, uptime; per node totals and up/down; servers and nodes in total
- Scrape config to copy and Grafana query examples on the admin page
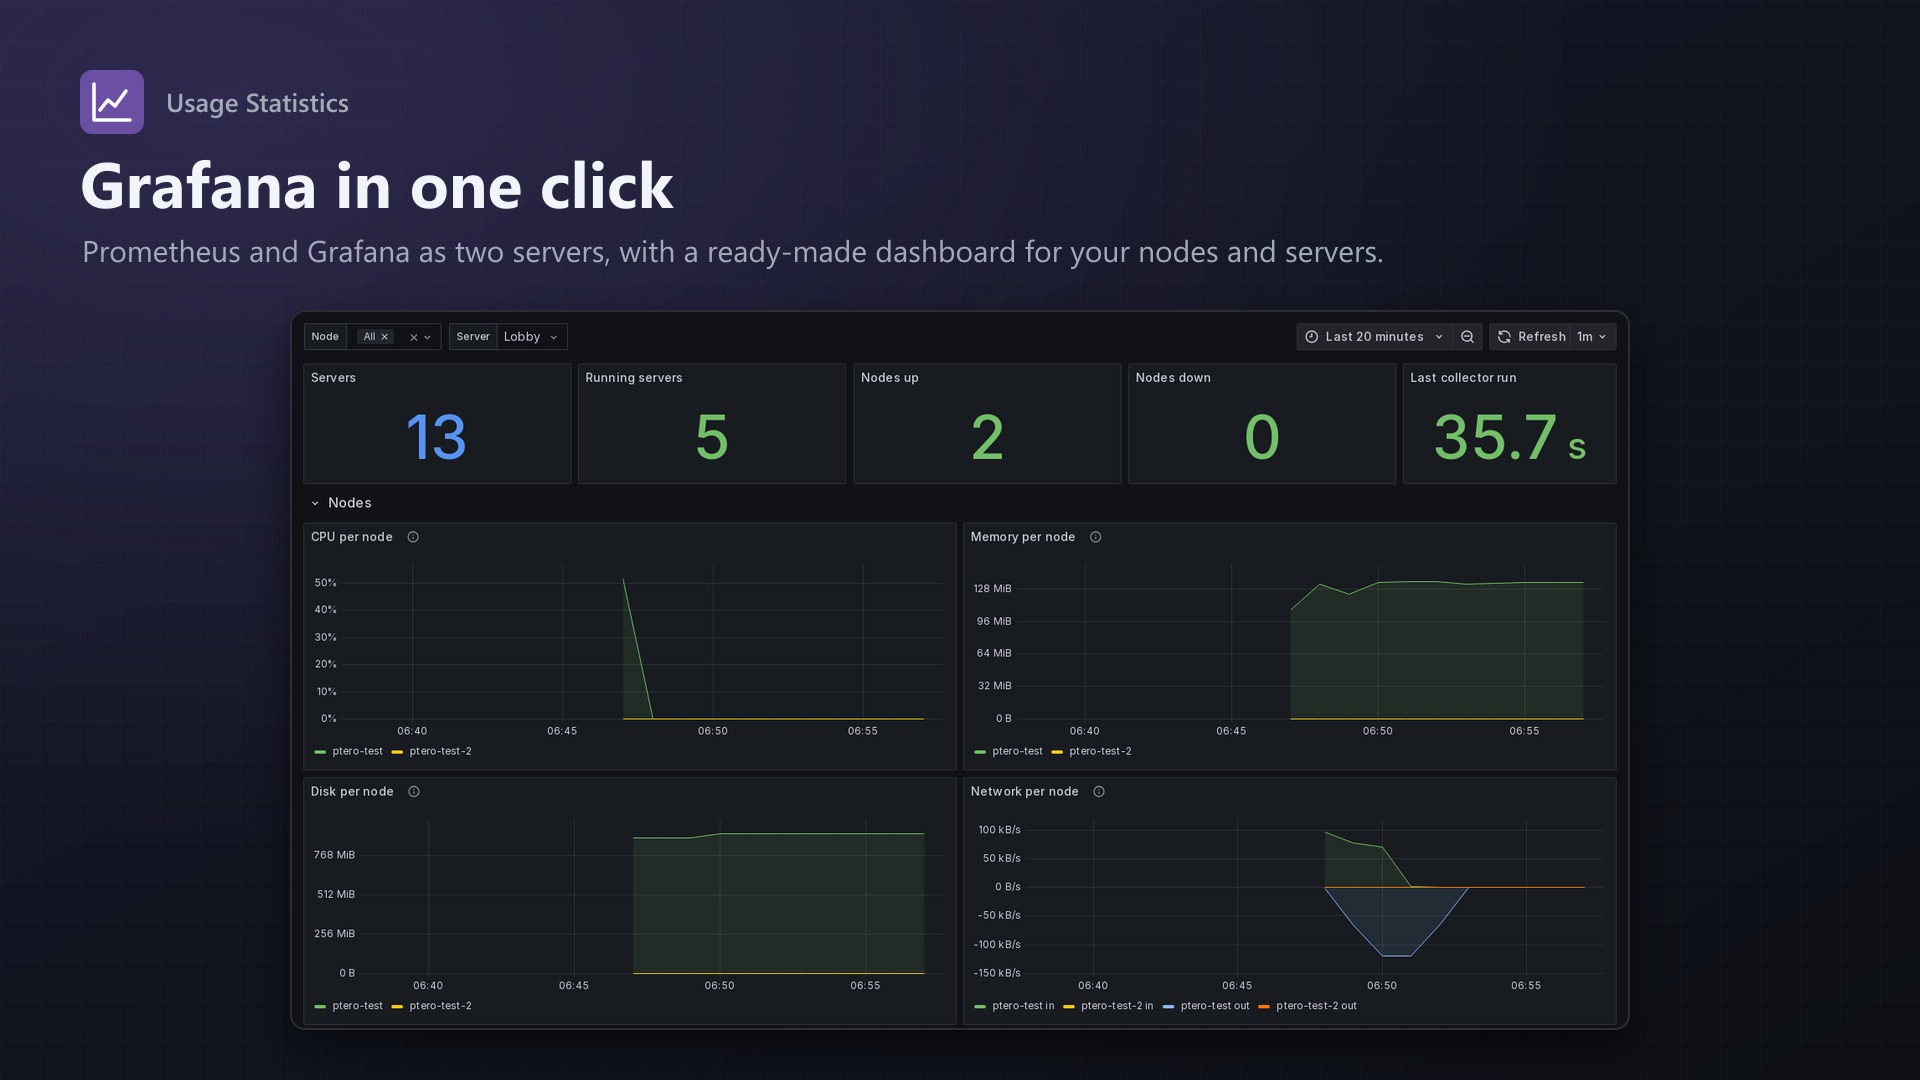
- Grafana in one click: creates Prometheus and Grafana as two servers in the panel, with the data source and a ready-made dashboard
- No core files modified
Licence
One purchase = one licence = one panel. The licence is bound to one panel domain and the server it runs on. Subdomains count as separate panels: test1.example.com and test2.example.com can't share a licence. You can move the licence to another panel at any time on texus-addons.de.
After buying, sign in on texus-addons.de with your sourceXchange email address. Your licence key is created automatically; download the extension there with the key built in, or enter the key on the extension's admin page.
Requirements
- Pterodactyl Panel 1.15.x with Wings 1.11 or newer on all nodes
- Blueprint (beta-2026-08 or newer)
- The panel's cron job (
schedule:runevery minute) - A licence key from texus-addons.de, free with your purchase, for one panel
- Outgoing HTTPS from the panel to texus-addons.de
Installation
- Upload
texusstats.blueprintto/var/www/pterodactyl - Run
blueprint -install texusstats - Enter the licence key under Admin > Extensions > Usage Statistics
Support
The README in the download explains every option. Questions and bug reports through the support link.
Website: texus-addons.de – licence keys, downloads and your account
Support: Discord support server or support@texus-addons.de